Technical article
Reducing Queue Contention in rsyslog with Local Frontends
- Published
- AI use
- AI-assisted
This work started with contention in a high-profile rsyslog deployment. I could temporarily work around the problem through configuration changes that reproduced part of the partitioning effect described below. That was useful operationally, but it also raised a design question: could rsyslog provide this separation directly, while retaining the queue lifecycle, failure handling and recovery behavior that operators already depend on?
The resulting implementation adds producer-local frontends to an existing logical queue. Most eligible submissions can move through a small single-producer/single-consumer queue. Work that does not fit uses a shared backend. Idle frontend consumers can also help process backend work. The backend keeps the existing disk-assistance machinery.
The architecture is straightforward to draw. Preserving rsyslog's semantics through it is considerably less straightforward. Messages mutate. Batches have variable sizes. Actions can block, suspend, retry or be interrupted after producing externally visible effects. Queues form processing graphs. A restarted process need not have the same worker population as the process that saved its backlog.
This article explains the design, the engineering behind it, and the measurements so far—including the experiments that did not demonstrate the expected benefit. A deliberately contention-heavy synthetic screen reached roughly twice the baseline throughput. That is encouraging evidence about a mechanism, with important resource differences. It is not a measured twofold improvement for the deployment that motivated the work.
As of 22 September 2026, the implementation is proposed in rsyslog PR #7593, and local scope remains experimental. The technical snapshot discussed here is f24574623; the performance measurements use explicitly identified earlier checkpoints. Those distinctions matter when reproducing a result.
I have strong confidence, based on my understanding of rsyslog’s processing model and the evidence collected so far, that this is a considerable improvement for workloads limited by shared-queue contention. That confidence is an engineering judgment, not a claim that the lab has already proved the production outcome. Representative practical use still needs to establish the size of the benefit and the conditions under which it holds.
When adding workers adds coordination
A conventional rsyslog action queue is shared by the workers submitting to that configured action. A queued ruleset similarly has its own shared queue. “Global” in this discussion means shared at that particular configured queue boundary. It does not mean that every action in the daemon uses one universal queue.
That boundary is a fan-in point: several producers submit work to one queue. Multiple consumers can provide fan-out on the other side. This is a useful and general arrangement. It also puts admission, dequeue and queue bookkeeping on shared synchronization paths.
Additional workers increase the opportunities for useful parallel execution. They can also increase the number of threads competing to update shared state. Once a shared coordination path limits progress, adding threads may yield little improvement. Depending on scheduling and workload, it can make the situation worse.
The deployment that prompted this work had a complex configuration on a very large machine. Destinations such as Elasticsearch add request latency, batching requirements and periods of backpressure. Queue buildup in that environment is a different problem from making a simple file-writing benchmark go faster.
The configuration workaround gave me a practical reason to explore partitioning. It did not prove that every workload would benefit, or tell me how much of the eventual implementation's benefit would come from private handoff, added execution capacity, buffering or scheduling. I still needed to separate those questions.
One logical queue, several places to hold work
The public configuration concept is queue.scope="local", added to the existing memory queue types. It is a scope choice, not a replacement storage type.
The default queue.scope="global" retains the shared queue. Local scope adds a bounded frontend for each registered producer. I will use FE for frontend and BE for the shared memory backend. Each FE has one producer and one consumer; the BE remains a multiple-producer/multiple-consumer queue.
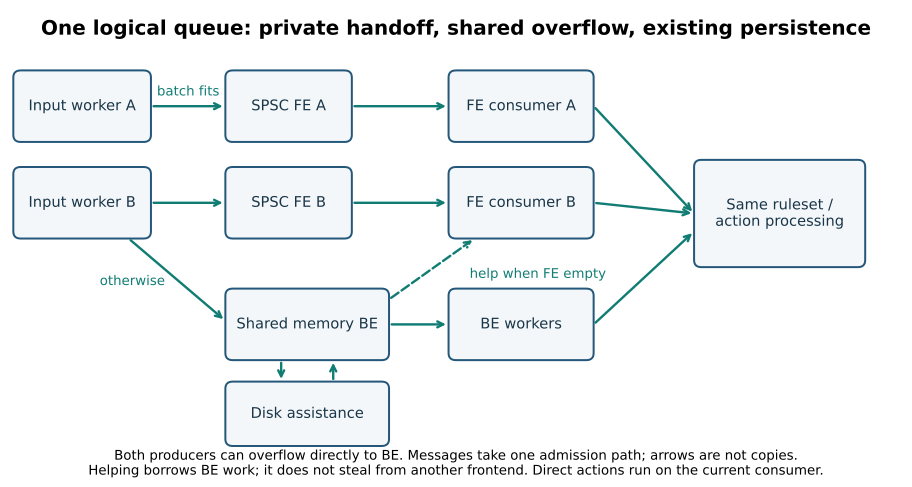
These paths belong to one logical queue. They share an admission and lifecycle contract. A frontend is not an independently configured action with a separate recovery identity.
The familiar memory/disk queue relationship is a useful starting point. A CPU cache hierarchy also provides a limited analogy: keep common traffic close to the worker and retain a shared place for excess work. But messages are not replicated cache lines. A submitted delivery obligation has one owning path, and transferring it must preserve that ownership. There is no cache-coherence protocol hiding the difficult parts.
An FE is also only conceptually close to Direct execution. With a Direct action, the caller performs the action itself. An SPSC frontend adds a distinct consumer and finite buffering. That extra thread is what decouples the producer from a temporarily slow consumer; it also consumes resources and introduces scheduling and wakeup costs.
The admission predicate is deliberately small
For an eligible registered producer, the central routing question is:
Does the producer's complete, actual submission fit into its frontend now?
If it fits, publish the entire submission to the FE. If it does not fit, submit the whole batch through BE admission. A submission larger than the FE's total capacity necessarily uses the BE. A producer that cannot obtain an FE registration also uses the BE.
There is no need to infer whether an output is “slow,” or to detect a stalled consumer before choosing the normal path. A blocked consumer can stop draining its frontend. Incoming submissions can use the remaining space. Once a submission no longer fits, it goes to the shared backend.
For example, an FE with 10,000 buffered messages can send the next 1,000-message submission to the BE. Its consumer still processes the already queued 10,000 through the FE path. As space becomes available, later fitting submissions can use the FE again. Overflow does not permanently switch that producer to the shared path.
This can reorder completion between FE and BE traffic. Existing multiworker queues already permit reordering, but that is not a reason to leave the new behavior implicit: a newer FE message may overtake an older overflow message. Local scope does not promise FIFO completion across these paths.
The producer avoids waiting specifically for FE space. It can still block at BE admission when the backend's flow control or capacity requires it. This design reduces synchronization on a common path; it does not provide unlimited buffering or remove destination backpressure.
The partition is a producer, not a TCP connection
With imtcp, multiple input workers may submit messages. The registration identity is the actual submitting worker. A frontend is not assigned to each network client, and sixteen TCP connections do not prove sixteen producers—or even a stable one-to-one relationship between connections and a smaller set of workers.
That distinction matters twice. It determines how many frontends and consumer threads are required. It also determines whether a “skewed input” experiment really concentrated work on one FE. I must observe registrations and execution ownership rather than infer them from connection counts.
The current implementation bounds registration with queue.local.maxFrontends. Exhaustion falls back to the BE. Registration slots are not recycled during that logical queue's lifetime, so producer churn is a resource consideration even if the number of simultaneously active inputs looks modest.
Batches are not fixed-size blocks of interchangeable messages
A queue's configured dequeue batch size is an upper limit. The actual batch can be smaller. Producer submissions, queue dequeues, action transactions and destination requests are related but distinct units.
I verified this explicitly before relying on a fixed-batch mental model. An early debugger-observed diagnostic with 20,000 messages observed 130 producer submissions ranging from 16 to 230 messages, and 90 nonempty consumer acquisitions ranging from 16 to 706, plus 111 empty acquisition attempts. The dequeue ceiling was 1,024. Both weighted histograms accounted for all 20,000 messages. Debugger intervention affects scheduling, so these observations demonstrate variable batching rather than an uninstrumented performance distribution. A ceiling alone does not describe what the implementation is doing.
There is a second complication: rsyslog is not applying one instruction stream to immutable data. A script can modify message-local properties, branch, call another ruleset and submit to an asynchronous action at different points. A single-message submission may be necessary to preserve an asynchronous mutation boundary. Delaying it to manufacture a larger FE batch would change semantics.
Destination batching has its own purpose. Elasticsearch may prefer a sufficiently large bulk request to amortize request overhead. An implementation that reduces queue-lock traffic but fragments every useful bulk request into tiny requests could lose overall.
The implementation therefore preserves the distinction between these units. It supports bounded minimum-batch waiting for FE work, clamped to FE capacity and governed by its timeout. BE helping does not wait to assemble a preferred minimum. A helper can acquire a short batch. It cannot simply merge obligations from unrelated source stores because a downstream target would prefer a larger request.
For evaluation, I need actual distributions at each relevant boundary: imtcp submissions, FE dequeues, BE acquisitions, action transactions and destination bulk requests. Count, sum and maximum counters help, but they cannot reconstruct a distribution.
Helping without breaking SPSC ownership
Private queues reduce sharing partly by restricting who may access them. That makes load balancing more subtle.
An FE consumer first attends to its own FE work and retained execution obligations. When eligible and locally empty, it can acquire a bounded batch from the shared memory BE. Dedicated BE workers remain available as well.
This is backend helping, not peer-frontend stealing. No worker takes messages directly from another FE. That keeps the SPSC ownership rule intact and avoids turning the frontend into a more general concurrent queue.
A consequence is stranded private work. If one producer submits a finite burst that fits entirely into its FE, other idle FE consumers cannot help with that private backlog. There may be nothing in the BE to acquire. Increasing FE capacity can increase this effect. A larger buffer is not automatically a better scheduler.
Helping also has a locality-versus-responsiveness tradeoff. A larger borrowed BE batch amortizes shared coordination, but delays the next check of newly arriving FE work. The configuration exposes queue.local.helperBatchSize; zero disables helping. The bound cannot exceed the FE's applicable dequeue bound.
The difficult implementation detail is that execution identity and completion ownership are different. A frontend worker borrowing BE work still has its own worker-local action state. The borrowed batch must complete, retry, release capacity and update accounting against its BE source. It must not be retired as FE work merely because an FE worker executed it.
I made that distinction explicit through batch ownership and source-aware completion paths. Independent concurrency review found a wakeup handoff defect during implementation: a selected helper could give priority to local work without ensuring another idle helper noticed pending BE work. A deterministic two-FE regression made the required handoff observable, and the protocol was corrected.
The fast path still needs a lifecycle
The ring uses the standard SPSC publication pattern: initialize slots, publish the producer position with release semantics, observe publication with acquire semantics, and release consumed slots only after their pointers have been copied out. Producer and consumer state are separated to avoid sharing cache lines unnecessarily. Cached opposite-side positions reduce repeated shared loads; apparent fullness must be refreshed before it causes a false fallback.
That does not make the complete system lock-free. Registration, worker lifecycle, sleep/wakeup coordination, logical accounting, BE processing and output modules have their own synchronization. A fast ring with an incorrect sleep protocol can lose a wakeup and stall indefinitely. A fast ring with expensive per-message bookkeeping can move the bottleneck instead of removing it.
Returning a ring slot also does not mean its message was delivered. The consumer may hold an active transaction or retry batch after removing messages from the FE. Those obligations still consume resources and must remain visible during shutdown.
For a backend capacity B, up to N frontends of capacity F, and D = min(queue.dequeueBatchSize, F), the documented conservative memory-obligation bound is:
B + N × (F + D)
It includes FE rings and active FE batches. It is not an RSS bound, and does not include disk backlog or downstream queues. Message sizes, object allocations, worker stacks and output state still matter.
This is why an equal-resource comparison needs more care than setting the same queue.size on both sides. Local scope adds memory and consumers unless I explicitly adjust the global comparison to match them.
Suspension, queue graphs and recovery
A remote endpoint that blocks a worker does not become faster because the input arrived through an FE. The consumer can remain blocked until the callback returns. It may subsequently suspend and retry. Additional workers may help if the destination can use more concurrency; they may achieve nothing if the remote service is already at capacity.
The FE/BE arrangement allows other eligible work to proceed and incoming batches to overflow. It does not safely “move” an executing callback to another thread. Unresolved transactions require a defined retention or transfer boundary. In particular, a consumer cannot push a retry back into its own SPSC producer end: that would add a second producer.
Direct actions continue to execute on the current queue worker. A queued action or queued ruleset adds another queue boundary. If that boundary is local, its actual callers—including upstream FE and BE workers—can register frontends there. A global boundary merges traffic again. The initial fully supported graph is acyclic, and downstream queues must be sized for actual callers rather than just the original imtcp worker count.
The output callback model remains the existing one. However, that does not mean arbitrary modules and options are automatically qualified. Shared action state, worker-private state, interruption and retry behavior must be checked. The implementation qualifies selected configurations of omfile, omfwd and omelasticsearch; it does not claim universal compatibility with every option those modules expose.
Shutdown is more than redirecting new traffic
Switching new FE admission to the BE is an important shutdown step. It is not the whole shutdown algorithm. Messages can already be in rings, active callbacks, retained retry batches or a helper's borrowed BE batch.
The shutdown protocol must stop admission at the appropriate boundary, quiesce execution, account for every remaining obligation, drain or transfer retained FE work, and invoke the existing persistence paths where configured. For a graph, upstream workers must be stopped in an order that still permits them to complete downstream submissions. Freeing a queue while an upstream callback can still submit into it is not a valid shortcut.
The durability boundary is the logical queue's existing persistent store, not the identity of an FE worker. That is what lets a subsequent process recover backlog with a different worker count, without reconstructing the old frontend forest. It still needs the correct persistent queue identity and compatible configuration. Deleting or reassigning the queue's store is not made safe by local scope.
Both classic and segmented disk assistance are supported. Helpers borrow from the memory BE; they do not bypass disk ownership and checkpoint logic by directly acquiring arbitrary disk records. A memory-only queue does not become durable because it has local frontends. Save-on-shutdown and disk configuration still determine what is retained.
Nor does this establish exactly-once external delivery. If an action performed a visible operation before interruption, replay can repeat it. Message mutations and action effects require explicit retry semantics. My recovery tests use controlled destinations and barriers when they assert exact final inventories, rather than pretending that an ambiguous interrupted network write has an exactly-once guarantee.
Established ideas, rsyslog-specific contracts
I also asked whether this was a known method. The answer is substantially yes at the scheduling level. It would be misleading to present private preferred queues with central overflow as a newly invented queue algorithm.
The closest architectural precedent I found is sdq1, described by Alexander Wirz, Michael Süß and Claudia Leopold in their OpenMP task-pool comparison. It combines bounded private queues with a central queue: new work goes centrally when private space is exhausted, and locally idle workers acquire central work. It does not steal from peer-private queues. Its private queue is owned by a thread that both inserts and executes, unlike my separate SPSC producer/consumer pair. The paper also highlights the importance of waiting efficiently rather than busy-spinning.
That work explicitly traces several task-pool implementations to Matthias Korch and Thomas Rauber’s earlier study, A comparison of task pools for dynamic load balancing of irregular algorithms. It supplies the earlier research lineage, rather than an independent validation of rsyslog. The academic references below give complete publication details and persistent identifiers for both papers.
Implementation sources illuminate individual parts of the design:
- moodycamel's queue design shows producer-specific subqueues behind one queue API and the importance of producer registration. Its consumers search subqueues; that is different from my dedicated FE consumer and shared overflow tier.
- Tokio's scheduler design provides examples of local/global scheduling, overflow and wakeup coordination. Its work stealing and overflow policy differ from this implementation.
- DPDK's ring documentation distinguishes all-or-nothing bulk operations from partial bursts. That is a useful distinction when specifying complete-submission routing.
- The Rigtorp SPSC implementation is a concrete reference for cached positions and refreshing the consumer position before declaring the ring full.
These sources support the architecture's plausibility and identify tradeoffs worth testing. They do not prove rsyslog's message ownership, action retry or persistence correctness, and their performance numbers do not predict ours. The useful engineering contribution here is fitting the scheduling family to those existing contracts.
What I implemented, in stages
I kept mechanism and integration work separate enough to test them independently:
| Stage | Purpose |
|---|---|
| S0 | Freeze the ownership, batching and measurement contracts; establish a baseline. |
| S1 | Introduce supporting ownership/accounting machinery before FE routing. |
| S2 | Add bounded frontend storage, producer registration and whole-submission FE/BE routing. |
| S3 | Let eligible idle FE consumers help drain the memory BE. |
| S4 | Support acyclic queue graphs, downstream registrations and qualified output execution. |
| S5 | Integrate classic and segmented disk assistance, shutdown consolidation and recovery. |
| S6 | Integrate queue options, sampling/discard policy, resource limits and observations. |
| S7 | Close out a bounded qualification effort, operator documentation and measurement method. |
This staging is important for interpreting the following tables. “S2” means an early frontend implementation without helping. “S3” adds helping. “S6” includes later integration work. They are historical checkpoints, not selectable product modes or different released queue types.
Correctness tests cover whole-batch overflow, partial batches, FE registration failure, producer exit, selected wakeup interleavings, borrowed BE ownership, action interruption, graph shutdown, store failure and recovery with changed worker counts. I used sanitizer runs and explicit barriers where timing alone could not prove an interleaving. Tooling limitations remain recorded rather than converted into passing-test claims.
The final reviewed snapshot's relevance-filtered local broad run contained 1,551 tests: 1,478 passed, 73 skipped and zero failed. Unrelated heavy-service families were omitted by the relevance gates, so this was not an unconditional full-suite run. A subsequent mock distribution check and the full static-analyzer run also passed. The 58 hosted checks on that snapshot comprised 55 successful and three skipped checks. Those results include unrelated rsyslog coverage; they are not 1,478 independent proofs about local queues. Local scope requires lock-free 64-bit atomics and monotonic condition variables; unsupported macOS runtime fixtures are skipped. The cancellation preload fixture also has explicitly documented sanitizer/launcher coverage limits.
First measurements: mixed results were useful evidence
My initial local tests were not a small copy of the motivating production system. They ran on an Intel Core i7-14700K development host under WSL2, using pinned Ubuntu 26.04 development containers and optimized builds. They were useful for controlled experiments, but the host was not exclusively reserved and its hybrid CPU topology is not a substitute for a large production server.
The early workload used eight imtcp workers, sixteen TCP connections, 512-byte payloads, JSON parsing and mutation, and synchronous omfile output. The dequeue ceiling was 1,024. Exact message-ID verification and process completion were required.
I first tested supporting machinery without frontend routing. Eleven alternating measured pairs per session, after a discarded calibration pair, did not yield an unambiguous performance verdict under the original acceptance rule. Balanced-session median elapsed ratios included 0.9773 and 0.9744, but a permitted repeat produced 1.0565. Low-load controls were near 1.0. I retained the unfavorable and inconclusive observations. A scaffolding stage with no FE fast path was not expected to produce the partitioning benefit in the first place.
Then I compared S2 with the global baseline, and S3 with S2, using both 4 million and 40 million messages. Each configuration used one discarded calibration pair and three alternating measured pairs. These were exploratory comparisons, deliberately smaller than the original qualification campaign.
The time metric ran from sender launch to receiver completion. Shutdown and exact-ID verification were required but outside that processing interval. The plots show the median of paired time ratios; the bars are the median absolute deviation of those ratios, not confidence intervals.
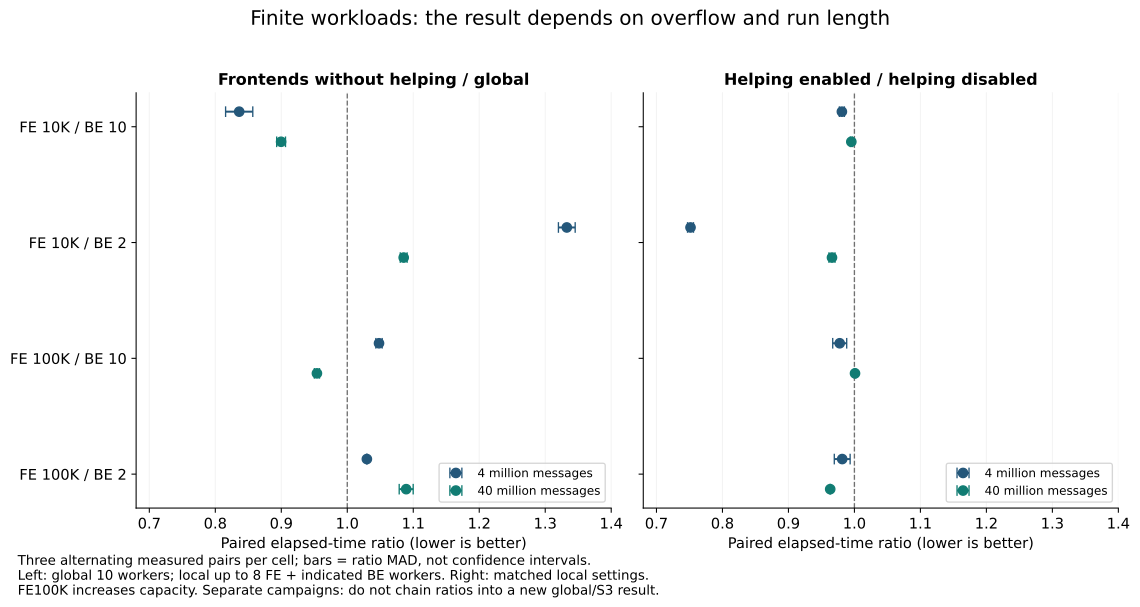
The global comparison had ten consumers and 1,088,192 message slots. A local queue had up to eight FEs and a one-million-slot BE. The FE10K/BE2 setting matches the intended ten-worker ceiling and includes the FE active-batch allowance in the global capacity. FE100K adds buffering. BE10 adds backend workers, taking the local worker ceiling to eighteen. Configured ceilings do not prove all workers were active throughout a run.
A few observations are particularly instructive:
| Comparison | 4M paired time ratio | 40M paired time ratio | Interpretation |
|---|---|---|---|
| S2/global, FE10K, BE2 | 1.3327 | 1.0855 | Frontends alone were slower in this setting. |
| S2/global, FE10K, BE10 | 0.8362 | 0.8997 | Faster, but with a higher total worker ceiling. |
| S3/S2, FE10K, BE2 | 0.7516 | 0.9660 | Helping shortened the short run by 24.8%; the long-run reduction was 3.4%. |
| S3/S2, FE100K, BE2 | 0.9815 | 0.9633 | The long-run reduction was 3.7%. |
| S3/S2, FE100K, BE10 | 0.9777 | 1.0009 | Essentially neutral in the longer run. |
These observations are consistent with helping reducing a finite run's final drain imbalance more than it improves the whole sustained processing interval. They do not prove that explanation by themselves. A separate diagnostic did establish that helping was active: FE helpers retired 403,456 backend messages in 394 batches during a 4M run, with all obligations accounted for at the end.
The global/S2 and S2/S3 tables come from separate campaigns. Host performance drifted. Multiplying ratios across them, or comparing their unrelated absolute medians, would manufacture a global/S3 comparison that I did not measure as a pair.
The lesson was not to discard the design because an early number looked disappointing. It was to ask what the test was actually limiting. A short, fast local output pipeline can spend substantial time in its generator, input handling, output serialization or scheduling without strongly stressing the queue coordination I intended to change. Merely increasing message count does not guarantee the intended contention pattern.
A sustained screen that actually created contention
I subsequently found a local stimulus that generated substantial shared-queue contention. It was designed as a mechanism stress test, not as a realistic Elasticsearch deployment.
Reproducing large-system coordination pressure in a smaller lab
Rsyslog already scales well with its existing queue implementation. In an ordinary deployment—and on the machines available in my lab—it can be surprisingly difficult to push shared-queue coordination hard enough to expose the contention seen in a much larger installation. High message counts alone do not establish that the engine is experiencing the same kind of pressure.
Finding a useful stimulus therefore became a small testing campaign in its own right. I explored finite workloads, longer runs, worker counts and output paths. The sustained setup with queue.dequeueBatchSize="1" became the most reliable way I found to stress shared-queue coordination in this environment. The purpose was to bring the engine into the contention regime that motivated the work, using the hardware and inflow I could provide.
A one-element dequeue maximum removes the opportunity to amortize a dequeue over several messages, increasing coordination frequency per processed message. It is a stress-test control, not a recommendation for tuning a production pipeline. It also does not mean that imtcp submissions or every output protocol request must contain one message: those are separate batching boundaries. In this screen I bounded helper acquisitions to one as well.
I expect this method to expose a mechanism that matters in practice: many workers competing for shared queue state. Large deployments can reach that pressure with normal batching and a much larger concurrent workload; reducing dequeue amortization lets me investigate it on a smaller system. That expectation is grounded in my understanding of the engine and the motivating deployment, but the correspondence still needs to be validated in those large environments. The synthetic screen does not establish that the relative costs, throughput gain or latency distribution match production. Final validation must retain the real configuration, normal batching, destination behavior and resource budget. This is both the reason for the test method and its main restriction.
The setup was deliberately different from the earlier throughput runs:
- Eight imtcp workers and 32 parallel loopback TCP connections.
- Repeated 100,000-message bursts, without intentional gaps, for a measured traffic window of at least 60 seconds.
- Sixty-four extra payload bytes, with identical message-local mutation and JSON template rendering on every revision.
- FixedArray BE capacity of two million messages, sixteen BE workers, worker activation minimum one, and dequeue batch maximum one.
- Synchronous omfile output to
/dev/null, with compression off. This removes persistent-output work; it is not a compression benchmark. - Mutex contention counters and one-second impstats enabled in all compared configurations.
- Local variants with up to eight FEs, FE capacity 10,000 or 100,000, and helper batch limit one.
The measured queue was directly downstream of imtcp. I did not place an unmeasured shared main queue before it and then attribute that queue's bottleneck to the candidate.
The sender repeatedly used this command shape, incrementing the starting message ID after each successful burst:
tests/tcpflood -s -t127.0.0.1 -p"$port" -c32 -Y \
    -i"$sent_messages" -m100000 -d64
The repeated invocation and connection behavior is part of the stimulus. It is not equivalent to thousands of long-lived client sessions. A final burst can extend beyond the deadline; I recorded actual duration and actual message count.
Completion required successful sender and daemon exits, action processed count equal to sent count, no failed or discarded messages, and an empty BE. Local variants also required accepted and terminal counts equal to sent, with zero logical outstanding work. Two settled polls separated by 1.1 seconds were part of the drain observation, so drain time includes that observation overhead.
Because the destination was /dev/null, these checks establish counter reconciliation, not exact IDs, uniqueness or content preservation. The delivery-checked finite tests supply separate correctness evidence. I must not merge their guarantees into a single stronger claim about the null-output run.
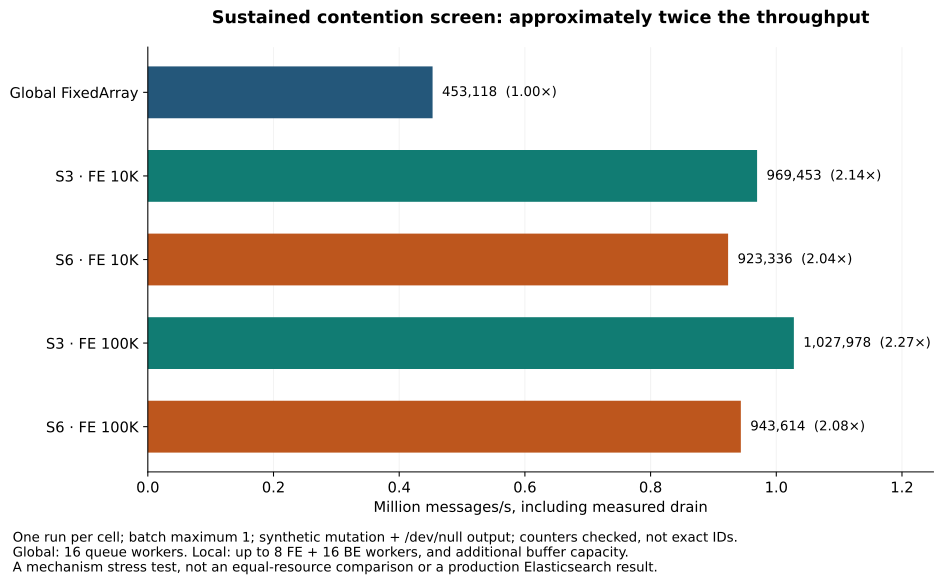
| Configuration | Messages processed | Traffic / drain (s) | Messages/s including drain | Relative to global |
|---|---|---|---|---|
| Global FixedArray | 30.0M | 60.589 / 5.618 | 453,118 | 1.00× |
| S3, FE10K | 64.8M | 60.072 / 6.770 | 969,453 | 2.14× |
| S6, FE10K | 63.8M | 60.066 / 9.031 | 923,336 | 2.04× |
| S3, FE100K | 71.9M | 60.852 / 9.091 | 1,027,978 | 2.27× |
| S6, FE100K | 65.2M | 60.058 / 9.039 | 943,614 | 2.08× |
Each cell is one run. The 100K follow-up reused the earlier baseline and 10K measurements; it was not a new paired campaign. There are no replicated confidence estimates here.
There is also an important resource difference. The global run has sixteen queue workers. Local runs add up to eight FE consumers to the same sixteen BE workers. Their conservative memory-obligation bounds are 2,080,008 at FE10K and 2,800,008 at FE100K, versus two million globally. This is a fixed-backend comparison, not equal total memory or equal total execution capacity.
Nevertheless, the mechanism is visible. Around 76–77% of messages in the local configurations used FE routing in these runs. Much of the ingress avoided the shared admission path, while overflow and helping continued to exercise the backend.
Fewer contention events did not always mean less accumulated waiting
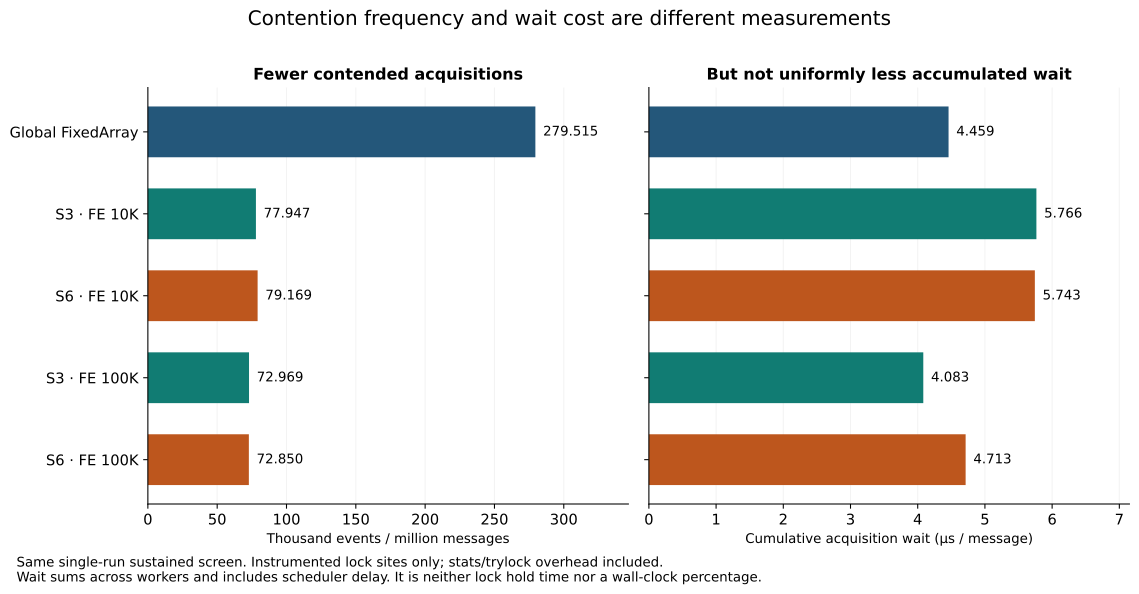
The global baseline recorded 279,515 contended acquisitions per million processed messages. The local variants were between 72,850 and 79,169. That is a substantial reduction in contention-event frequency at the instrumented sites.
But cumulative acquisition wait per message did not improve uniformly. Global recorded 4.459 microseconds. FE10K recorded 5.766 for S3 and 5.743 for S6. FE100K recorded 4.083 and 4.713 respectively.
These are accumulated waits across threads, including scheduling delay. They are not mutex hold times and not percentages of one wall-clock interval. Faster throughput, fewer contended acquisitions and a larger accumulated wait per processed message can coexist when execution topology and where work waits have changed. The counters need to be interpreted together, not reduced to “contention disappeared.” Instrumentation overhead also belongs to these measurements.
Larger FEs were not free. Moving from 10K to 100K increased observed throughput by about 6.0% for S3 and 2.2% for S6, while peak RSS rose from approximately 1,649/1,654 MiB to 2,205/2,208 MiB. FE route share barely changed. A small single-run throughput difference is weak evidence for accepting a substantial memory increase.
The original LinkedList reproduction was slower still, at 215,357 messages/s including drain, and clearly showed contention. I deliberately did not use it as the denominator above: the local S3 checkpoint required FixedArray, so the useful comparison used a newly measured FixedArray baseline.
What the lab cannot yet tell me
My lab does not have the combination of very large machines, huge sustained real-world inflow, many independent clients, and the complex remote-service behavior that produced the original operational problem. I can generate a high synthetic message rate locally. That is not the same resource or failure environment.
A production workload involving hundreds or thousands of clients and several hundred thousand messages per minute can be difficult even when a local synthetic benchmark shows a much higher raw rate. Message size, transformations, active action count, destination latency, request batching, retries, NUMA placement and traffic skew determine how much work each message creates and where threads meet. The headline message rate alone does not characterize contention.
A full Elasticsearch experiment would additionally need a controlled cluster: shard and replica settings, index and refresh policy, request sizing, rejection behavior and health. I deliberately did not run a resource-heavy cluster campaign merely to attach an Elasticsearch name to a synthetic result. Support for the module's qualified execution paths and measurement of a representative cluster workload are different milestones.
I also tried a fixed-rate latency observer. It delivered and verified all 100,000 messages, but its own timing contract failed: maximum dispatch lateness was about 4.30 ms and the reader iteration interval reached 7.75 ms, both above the predeclared 0.40 ms limit. Its p99 is therefore not an accepted queue-latency result. Reporting it as one would turn a measurement failure into a product claim.
The next useful target comparison should freeze a real configuration and resource budget, then hold offered load constant across global and local modes. It should record successful destination completions, daemon CPU per successful item, backlog and oldest-message age, retries/rejections, actual batch distributions, and an explicitly valid latency boundary. At a fixed offered rate, elapsed time is largely sender-paced; a reduction in CPU or backlog growth can matter more than a higher peak message rate.
I also need matched FE-plus-BE worker budgets, matched memory bounds, repeated alternating runs, actual worker inventories, and CPU/NUMA placement. A queue's terminal counter is not a substitute for successful indexing: terminal retirement may include a configured discard path. A finite rising backlog is a warning to investigate, not by itself proof of indefinitely growing backlog.
For operators able to reproduce the motivating class of workload, a carefully controlled pilot is more valuable than another large collection of /dev/null numbers. The questions are specific: does partitioning reduce coordination cost at the real load, does it preserve destination batch efficiency, and does backlog remain bounded under the same resource budget?
Trying the design without overstating its scope
The feature is opt-in. If local mode is not activated, the frontend submission path, FE worker pools and backend-helping mechanism remain inactive; global queues continue through the established queue implementation. There is a precise qualification: the patch adds guard checks and shared integration bookkeeping, so “no new code executes” would be literally too strong. The submission guards and queue startup make the boundary explicit. This is not a claim of mathematically zero overhead.
The configuration surface is small, but the compatibility envelope is intentionally explicit. Local scope supports FixedArray and LinkedList memory backends, including classic or segmented disk assistance. Pure Disk and Direct queues cannot themselves be local. Selected imtcp-rooted acyclic pipelines and selected output configurations are qualified; arbitrary modules, dynamic call graphs and every action option are not.
This is a topology sketch for a controlled local experiment, not a production recommendation:
module(load="imtcp")
main_queue(
    queue.type="FixedArray"
    queue.scope="local"
    queue.size="1000000"
    queue.workerThreads="2"
    queue.dequeueBatchSize="1024"
    queue.local.frontendSize="10000"
    queue.local.maxFrontends="8"
    queue.local.helperBatchSize="1024"
    queue.local.frontendStats="on"
)
input(type="imtcp" address="127.0.0.1" port="13514" workerThreads="8")
template(name="localExample" type="string" string="%msg%\n")
action(type="omfile" file="/dev/null" template="localExample"
       asyncWriting="off" flushOnTXEnd="on")
It intentionally discards output and has no disk persistence. It also differs from the batch-one contention screen. Use the complete configuration validator (rsyslogd -N1) and the snapshot's operator documentation for the supported combinations. Do not add asynchronous action queues to inexpensive outputs merely because this feature exists.
For diagnosis, inspect both the logical queue and its frontends. The local summary exposes FE/BE routing and outstanding obligations. Optional per-FE objects reveal imbalance that a BE size counter hides. Observe FE queued and active work, helper completions, registered and running workers, backend occupancy, disk activity and the destination's own success/failure measures. An empty BE does not imply that the logical queue is empty.
The design's promise is precise: reduce shared coordination for common submissions while retaining an overflow path and rsyslog's existing processing and persistence machinery. I have implemented that path, exercised its difficult lifecycle cases, and demonstrated a substantial improvement in a workload that deliberately stresses queue contention. The remaining production question requires the kind of system that motivated the work—and measurements that preserve its actual costs.
Reproduction and further reading
The curated numerical data behind these plots is available separately. The figures are programmatically plotted measurements, not generative illustrations. The blog repository contains the Matplotlib generator alongside the article assets.
For the paired finite tests, use the benchmark harness at the technical snapshot and the command/settings recorded in the execution ledger. Baseline: b0d9f971f; S2: 54dbe936; the final S3 paired campaign used the optimized runtime at 8faa24cf. Retain the distinction between executable source and later test-only changes when rebuilding.
For the sustained screen, the baseline is again b0d9f971f, with S3 58570a0f and S6 31796c8e. Builds used GCC with -O2 -g and the same Ubuntu 26.04 image, pinned to:
sha256:32ade478a405e4f27f077b5268ec5ecc59dd572843ad67ca2b6723594960ae09
The full stimulus, completion checks and limitations are the reproducible record. The published baseline is the original common ancestor, not a newly selected current-main release or a measurement of global mode in the final candidate.
The design and invariants and related-work synthesis provide the longer engineering record. Design-stage proposals in those documents should be read alongside the implemented operator contract, rather than treated as additional supported features.
For a complementary example of working from a real pipeline bottleneck through architecture to carefully scoped performance claims, see Jérémie Jourdin's Making Room for Intelligence at the Edge. It concerns a different part of the logging pipeline; its results are not evidence for the queue implementation described here.
Academic references
- Alexander Wirz, Michael Süß and Claudia Leopold. A Comparison of Task Pool Variants in OpenMP and a Proposal for a Solution to the Busy Waiting Problem. In OpenMP Shared Memory Parallel Programming, Lecture Notes in Computer Science 4315, pp. 397–408. Springer’s publisher citation gives 2008. DOI: 10.1007/978-3-540-68555-5_32. Author-hosted full text, especially Section 2.2 for sdq1 and Section 2.3 for waiting. This is the direct architectural reference used above; the author-hosted manuscript provides the accessible technical description.
- Matthias Korch and Thomas Rauber. A comparison of task pools for dynamic load balancing of irregular algorithms. Concurrency and Computation: Practice and Experience 16(1), pp. 1–47, 2004; first published online 4 December 2003. DOI: 10.1002/cpe.745. Publisher record. This is the earlier task-pool study identified by Wirz and colleagues, covering implementations with POSIX threads and Java.
These academic references establish the research context for the scheduling family. The separately linked implementation articles and library documentation explain individual engineering techniques. Neither group substitutes for correctness evidence or performance measurements of this rsyslog implementation.