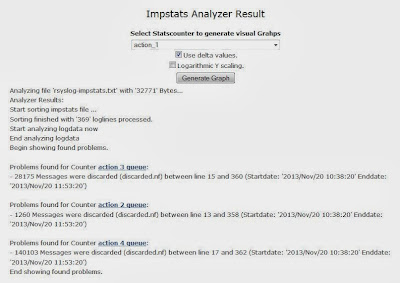
My co-worker Andre had a little time and extended the rsyslog impstats analyzer to support generating graphs. IMHO this gives you fantastic insight into how the system operates. While I know that some folks already push this data to their internal health monitoring system, the beauty of the online rsyslog impstats analyzer is that you do not need to install anything — a log file with stats is all you need to get you going. Let’s look at a quick sample. This is a page returned by the analyzer’s check phase:
If you look closely, you notice that there are active links to the problem areas. Let’s follow the one to action 3 queue:
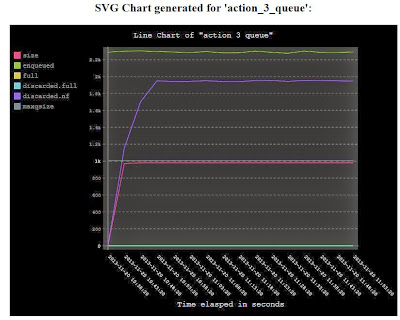
Here, we see the problem in action: the queue initially behaves well, but relatively soon keeps it’s size at close to 1k messages. At the same time, the enqueue rate (green line) is much higher. Consequently, the discard rate (blue line) is getting pretty high. The delta between discard and enqueue line is what is actually processed: obviously far too few messages to keep up.
BTW: this chart is from a real-world case. One problem here was that the queue’s discard mark was set too low (close to 1k), so that the queue never could fill up over the 1k mark even though it had a much larger max size. When we fixed this, we saw that the queue consumer (a script) could actually not keep up with the message volume (not shown here). So this hint from the graph was also pointing to a real problem (but you need to fix one problem after another and then look at new stats).
Note that graphics can also be generated for non-problem counters – you can select from a menu on top of the pages (see first screenshot). The web app supports cumulated stats and can create delta values out of them. It also offers the ability to use logarithmic y axis scaling, which is useful in some cases. The app does not well handle imudp traffic. The reason is that imudp reports both ipv4 and ipv6 listeners with the same counter name, and so we don’t have any chance to differentiate between them. An update for imudp is planned to address this.
More enhancements for the statistics analyzer are planned. We are actively looking for feedback.


